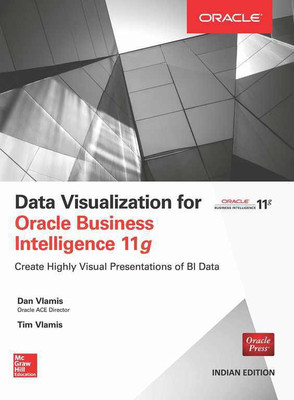
Data Visualization for Oracle Business Intelligence 11g 1st Edition(English, Paperback, Tim Vlamis, Dan Vlamis)
Quick Overview
Product Price Comparison
Co-written by an Oracle ACE Director and an expert in data visualization design specializing in BI and analytics, Data Visualization for Oracle Business Intelligence 11g reveals best practices for presenting data-driven insights with graphs, tables, maps, dashboards, and other methods that will immediately enhance corporate decision-making. Throughout the book, the principles of effective design are emphasized. Leverage the power of this comprehensive business intelligence platform to deliver rich visualizations of business information across the enterprise. Salient FeaturesCreate well-organized tables and pivot tablesConvey data insights with line, bar, pie, waterfall, radar, and other graphs.Configure map views so that you can provide interactive maps and spatial analysis capabilities.


