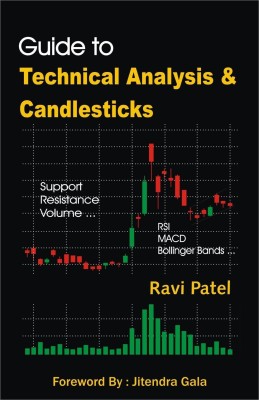
Technical Analysis & Candlesticks Guide : Trading Chart Patterns & Candlestick Patterns By Ravi Patel(Paperback, Ravi Patel)
Quick Overview
Product Price Comparison
Technical Analysis is a method of examination of past price movements to forecast future price movements to identify trading opportunities. This Book will teach a trader or investor basics of technical analysis so that he can pick right stocks at right time to make money from trading or investing in them. The book will teach you how to use various technical analysis tools like support - resistance, moving averages, candlestick patterns, chart patterns, technical indicators and oscillators, etc with help of various case studies and charts. The book also teaches how to effectively manage risk using stop losses and how to exit trades at right time to book maximum profits. Technical Analysis Concepts explained in this book can be used for Intraday (day trading), Short Term Positional Trading, Swing Trading, BTST & STBT (Buy Today Sell Tomorrow & Sell Today Buy Tomorrow), Futures & Options, Delivery Based Trading as well as deciding entry and exit timings for Long Term Investing as well. Candlesticks like Doji, Star, Hammer, Hanging Man, Piercing Line, Dark Cloud Cover, Engulfing Pattern, etc are explained in this book. Chart Patterns like Head & Shoulder, Inverted Head & Shoulder, Rising Wedge, Double Top, Double Bottom, Rounding Bottom, Triangle Patterns, Flags, Price Channels, Cup & Handle, etc are explained. Technical Indicators like Moving Averages, MACD, RSI, ROC, OBV, Accumulation Distribution, Bollinger Bands, etc are explained. Stock Selection Strategies used in Bull, Bear and Volatile Markets explained along with various case studies on Candlesticks, Chart Patterns and Technical Indicators.


